Format
of the surrogate datasets
Each zip file contains 100 test files labeled
NSol-K-E-J.mat
with
K=2,3,5 (number of 'hidden' clusters/spike patterns)
E=1,...10 (extra spike levels: in order :
0,2,3,4,8,11,15,20,25,35 extra spikes per trial)
J=1,...10 (jitter levels: in order: 0, 1, 3, 5, 10, 15, 20, 30, 40, 50
ms)
Loading one of these files in Matlab will create 3 useful variables
1: rspiketimes(Ntrials, N,
MaxNspikes)
Contains the spike times of N rastergrams (here N is
always 30). Each rastergram contains Ntrials (here each cluster/spike
pattern contains 35 trials, therefore Ntrials=K*35). MaxNspikes is the
maximum number of spiketimes (zero padded) stored in the matrix (here
always 70). Note: all times are normalized between 0 and 1 second. This
matrix is the only datastructure that the clustering algorithm should
'see'.
for example:
>> load
NSol-3-5-3.mat %
contains surrogate sets containing 3 hidden clusters. Each trial has 8
spikes that do not belong to any clusters (extra spikes), and the
spikes that belong to an event have 3 ms jitter)
>>
a=squeeze(rspiketimes(2,5,1:20)); % a contains the 1st 20
stiketimes of the second trial of the 5th rastergram.
>> a'
ans =
Columns 1 through 13
0.0586
0.1146
0.1297
0.1643
0.2687
0.3121
0.3546
0.5178
0.558
0.6989
0.7693
0.8065 0.9042
Columns 14 through 20
0.9204
0
0
0
0
0 0
>>
% There are 14 spikes in this trial
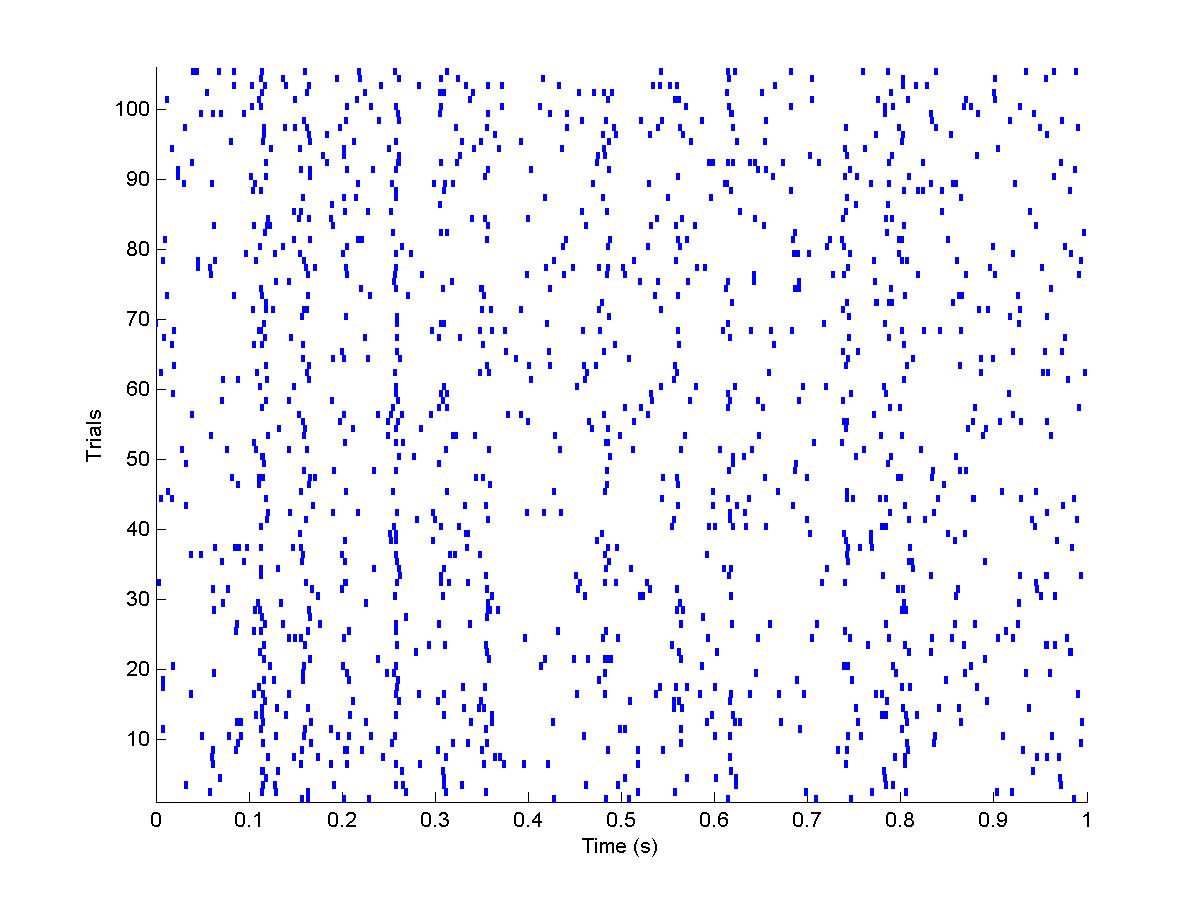
>> rasterplot(rspiketimes,5) %
will plot all the trials of the 5th rastergram for you.
2: spiketimes(Ntrials, N,
MaxNspikes)
is the exact same matrix as above, but for each
rastergram, the trials have been re-ordered by a clustering algorithm
to show the spike patterns.
>> rasterplot(spiketimes,5) %
will plot all the reordered trials of the 5th rastergram for you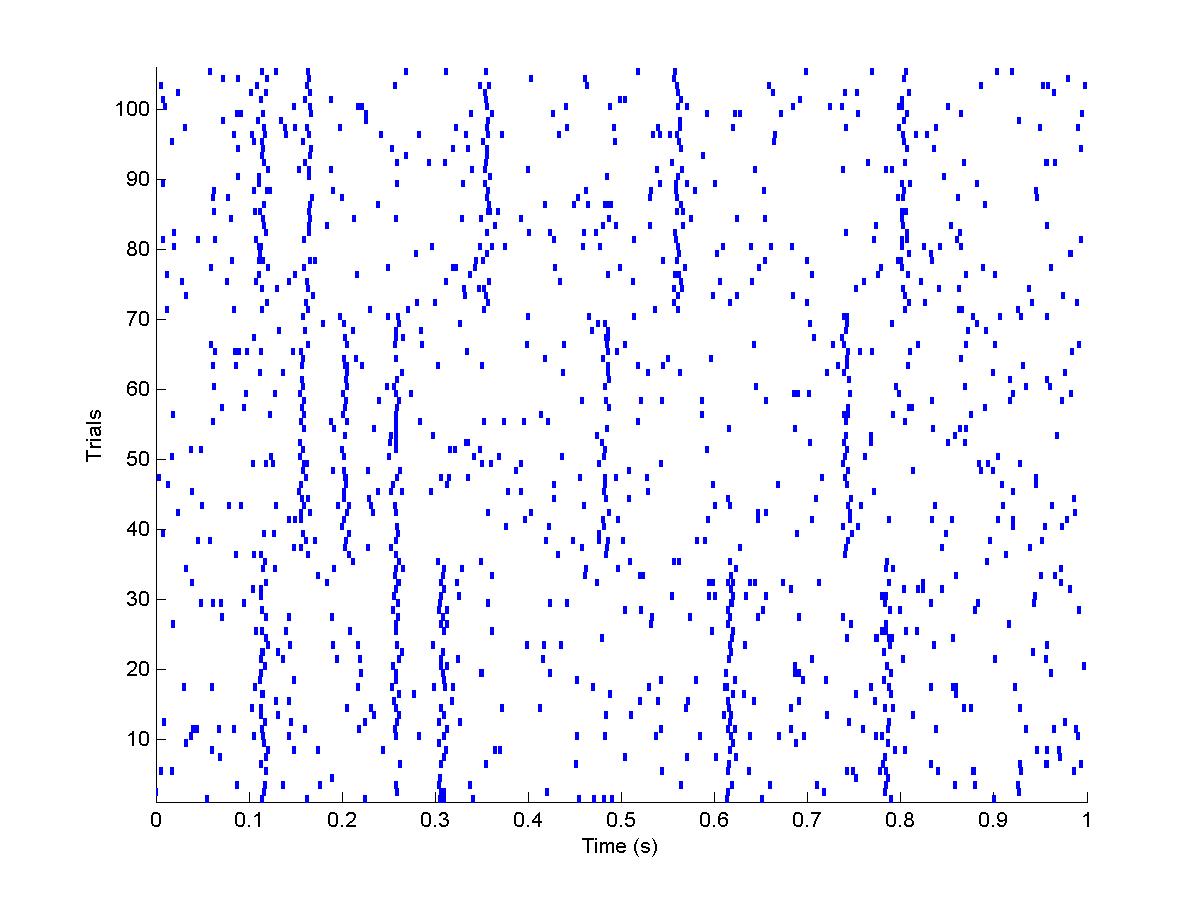
3: rpidx
Contains the 'correct' reordering indexes to
apply to spiketimes to get rspiketimes. Note: for simplicity, all N
rastergrams are reordered the same way (but the clustering algorithm
should NOT assume so)
>> rpidx
rpidx =
Columns 1 through 28
44
105 34 7
22 55 8
63 94 43
101 99 25
74 35 10
89 39 60
56 86 79
92 41 36
3 93 85
Columns 29 through 56
98 33 87
47 6 13
57 51 65
53 52 30
72 23 73
5 46 90
78 54 9
16 75 67
77 68 70 45
Columns 57 through 84
28 27 26
18 104 103
82 48 40
95 12 80
2 61 49
24 71 19
15 66 38
81 59 62
100 20 88 91
Columns 85 through 105
37 4 64
31 17 102
42 32 69
50 84 83
97 58 29
14 76 1
96 21 11
(events, fname
and nfname are also created but are not used here)
Back to main
page